Kankakee County, Illinois, is ideally situated 45 miles south of Downtown Chicago along the I-57 Corridor. Ready access to interstate, rail, all utilities, fiber and workforce helps our diversified business community to thrive. A suite of stackable incentives supports targeted industrial, commercial and residential investment.
*Source: U.S. Census Bureau
Kankakee County offers a significantly lower cost of living compared to the national average, giving residents more buying power and employers a strategic edge. With housing costs well below national benchmarks and everyday essentials remaining competitive, the region supports both workforce stability and long-term economic growth.
*Based on 100% as the National average
*Source: Council for Community and Economic Research
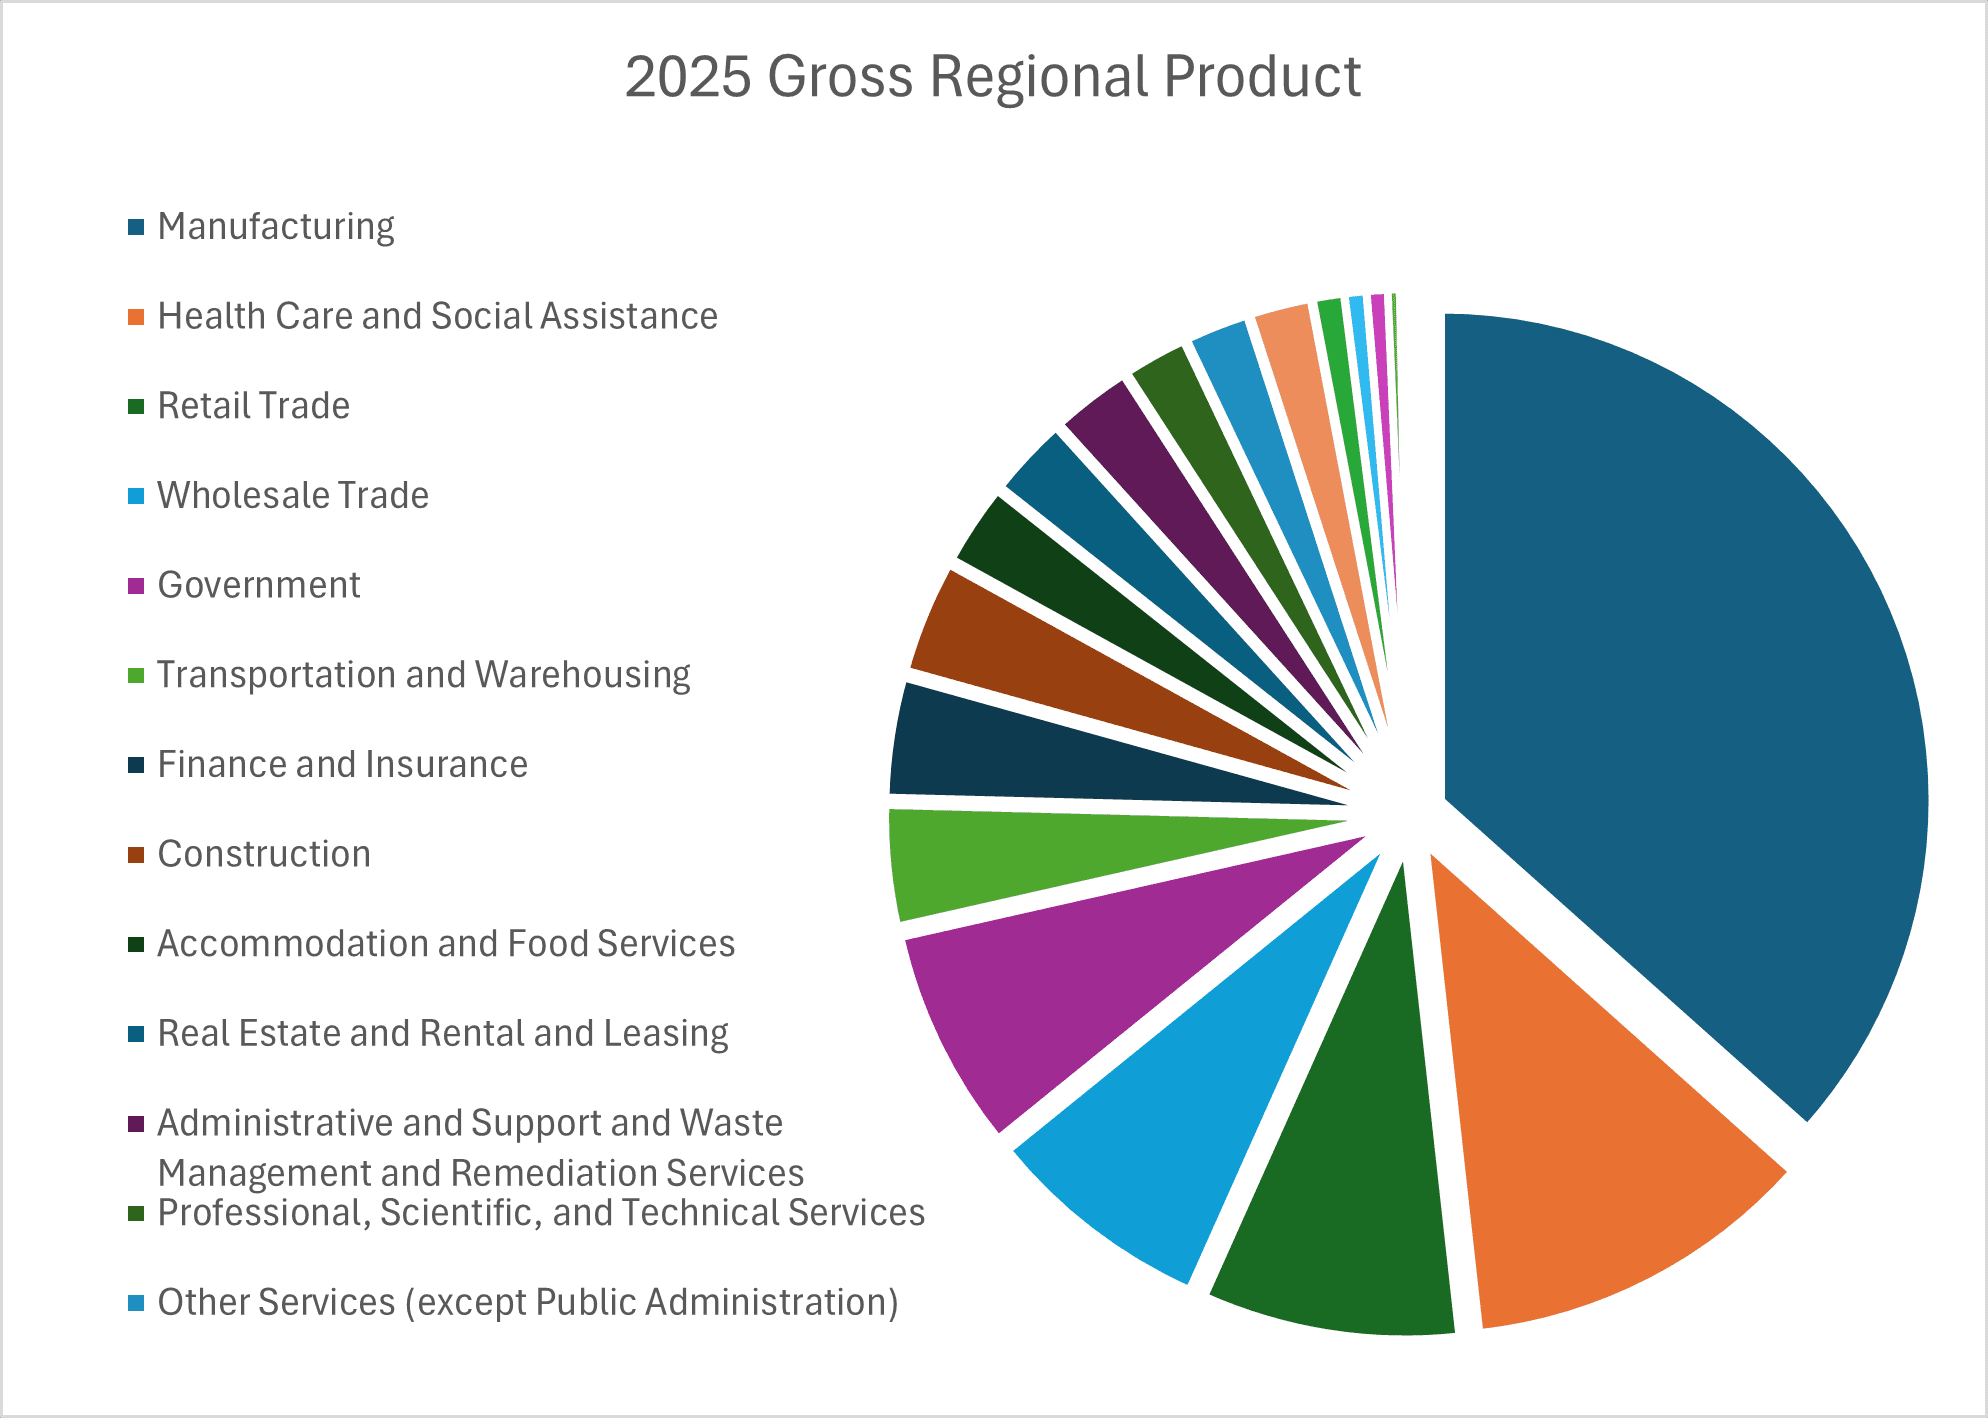
Total gross regional product for Kankakee County was $6.2 billion in 2025, with the leading sectors being manufacturing and health care.
Strategically located in the Chicago metropolitan region, Kankakee County, IL, has a total labor force of more than 808,000 within a 30-minute drive radius, more than 2.8 million within a 45-minute drive radius.
As of July 2024, Kankakee County’s Civilian Labor Force numbered 53,309, according to the U.S. Bureau of Labor Statistics and the Federal Reserve Bank of St. Louis.
Kankakee County partners with educational institutions, training providers, and regional workforce organizations to develop talent aligned with employer needs. Explore programs, certifications, and training pathways that strengthen the pipeline of skilled workers.
Take the first bold step toward transforming potential into tangible economic success in Kankakee County.